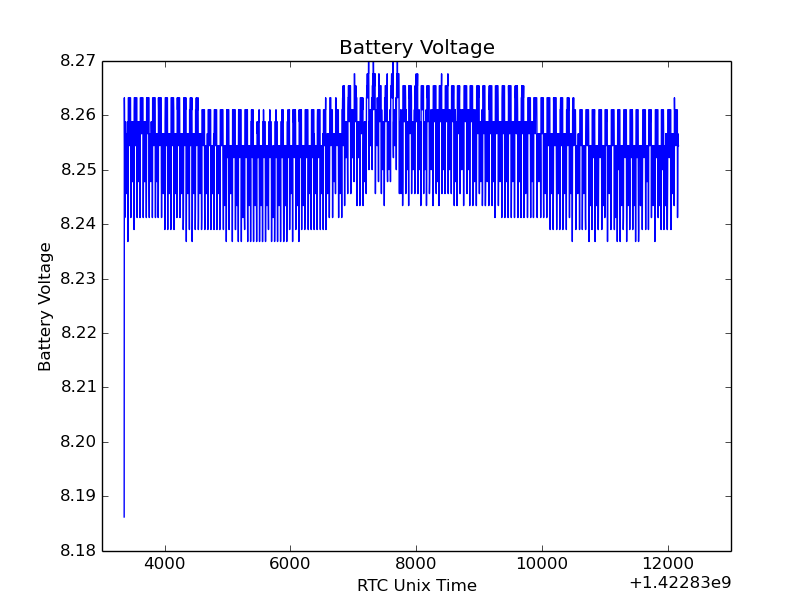
Thanks to Ham operators worldwide, we have completed downlink of the three 1-Hz telemetry runs conducted during early GRIFEX operations (1 Feb 2015 23:29 – 2 Feb 2015 01:56, 3 Feb 2015 00:22 – 05:16, and 9 Feb 2015 02:00 – 04:32). We’ve taken a look at these and some interesting trends emerge.
In all three runs, we see that the battery is near full State Of Charge (SOC) for the entire orbit! Being in full sun all the time has its benefits:
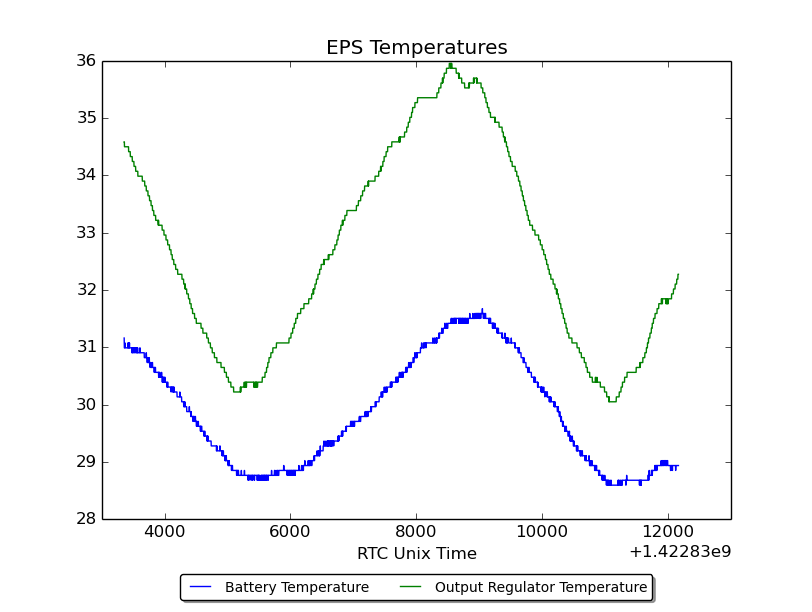
But what about the temperature? Battery temperature is one of the data points we watch most closely on-orbit, as our Lithium-Ion batteries have the narrowest thermal constraints of any of the hardware on the spacecraft (charge temperature 0 to 45 degrees Celsius). We were all relieved to see the battery temperature staying close to 30 degrees Celsius.
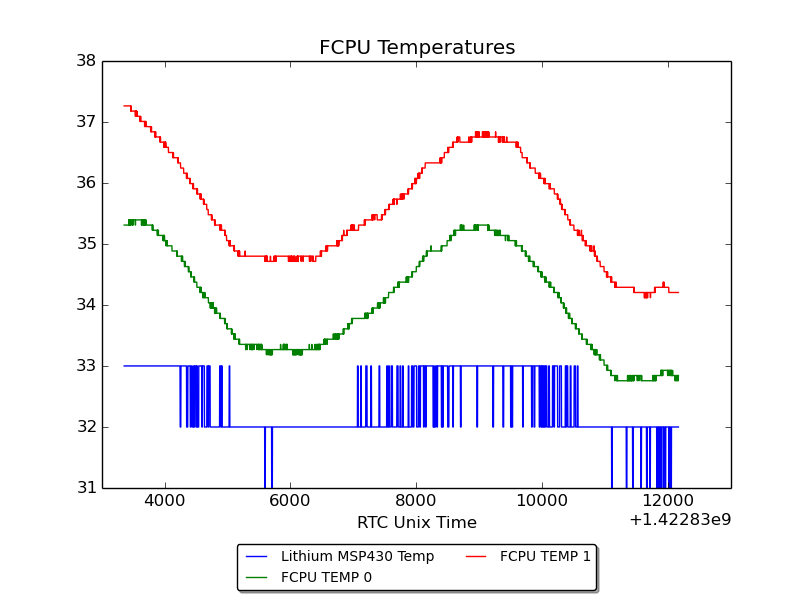
Many Hams have noticed the radio temperature going up as we downlink over them, and our adjustments to transmit power level to try to mitigate this. As it happens, we caught a downlink during one of our 1-Hz telemetry runs. At the time of this downlink, the radio transmit power was at ~0.5W:
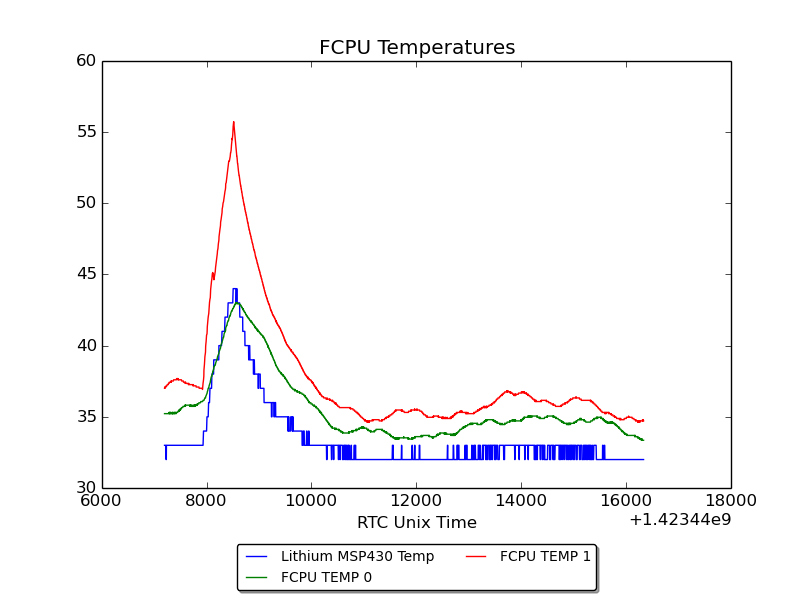
Looks like FCPU TEMP 1 (directly under the radio’s power amplifier) gets pretty hot! The good news is, the processor inside the radio, along with the Flight Computer itself (FCPU TEMP 0) don’t get the full heat.
Temperatures elsewhere in the spacecraft are hot for humans, but relatively mild for avionics (usually rated to 85 or 125 degrees C). For reference, we’ve included an FCPU temperature from the same time period (no downlinks occurred during this time window) in the plots below. Note for those curious about the acronyms, EPS = Electrical Power System, TCB = Torquer Control Board, FCPU = Flight CPU [Flight Computer])
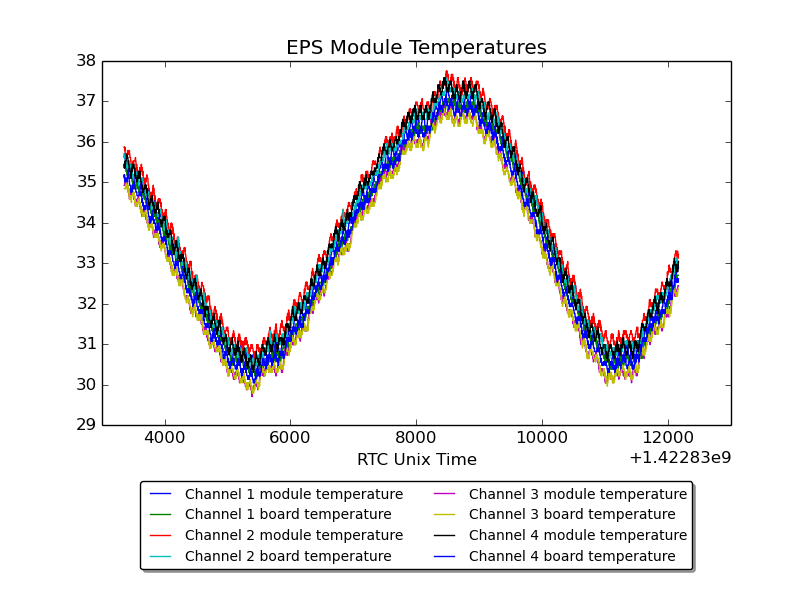
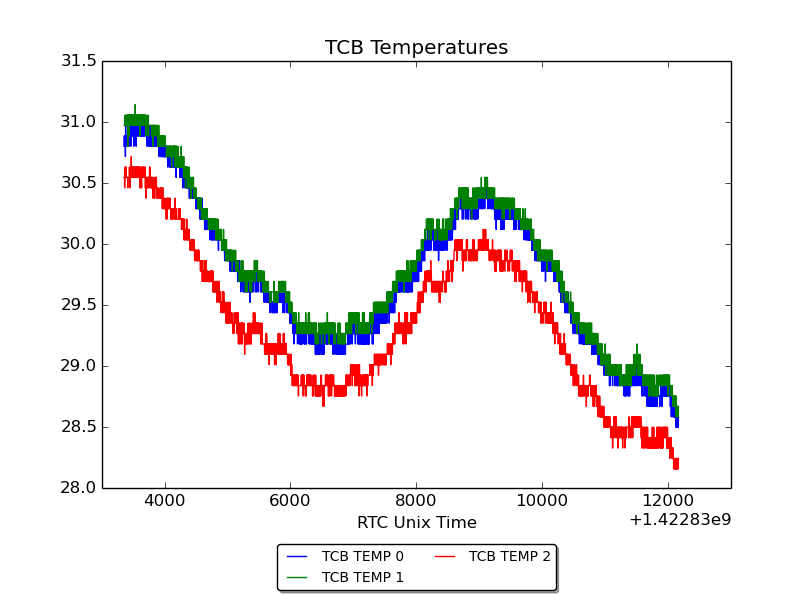
Looking closely at the EPS module temperatures, you can see a small, short-period sinusoidal trend overlaid on the larger overall sinusoidal trend, presumably due to each input regulation module receiving solar power in turn as the satellite rotates (one input regulation module corresponds to one panel).
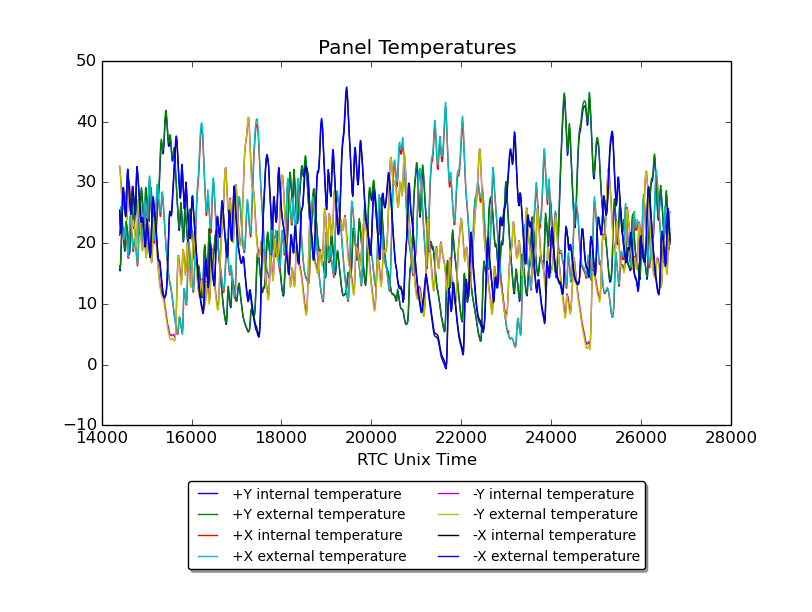
Panel temperatures were a wildcard when making these plots. In the earliest 1-Hz run, panel temperatures varied a lot, but mostly tracked the trends of the other subsystems:
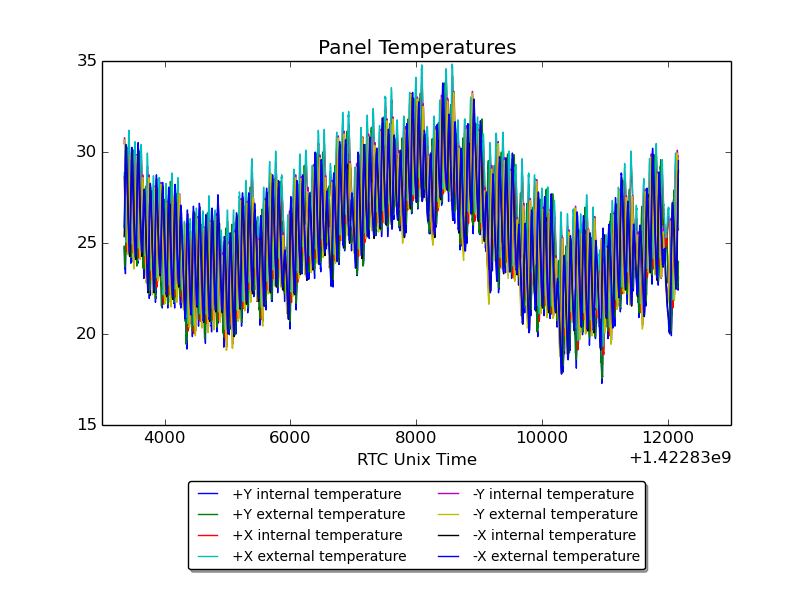
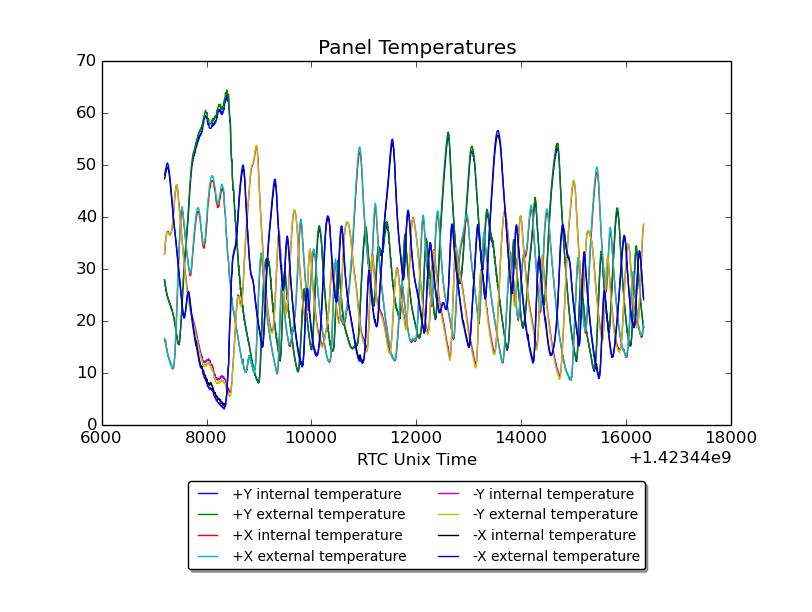
However, as the satellite continued to de-tumble, panel temperatures showed greater temperature extremes. Here’s the second run (run #1):
On the 3rd and final run (run #2), the panels got as hot as 60 degrees! This was during a downlink, so this may have been related to the rising radio temperature. However, the fact that other panels were approaching 0 degrees at that time suggests that the orientation of the satellite relative to the sun may have also been a factor. The good news is, temperatures are staying well within a safe range for our bus avionics.
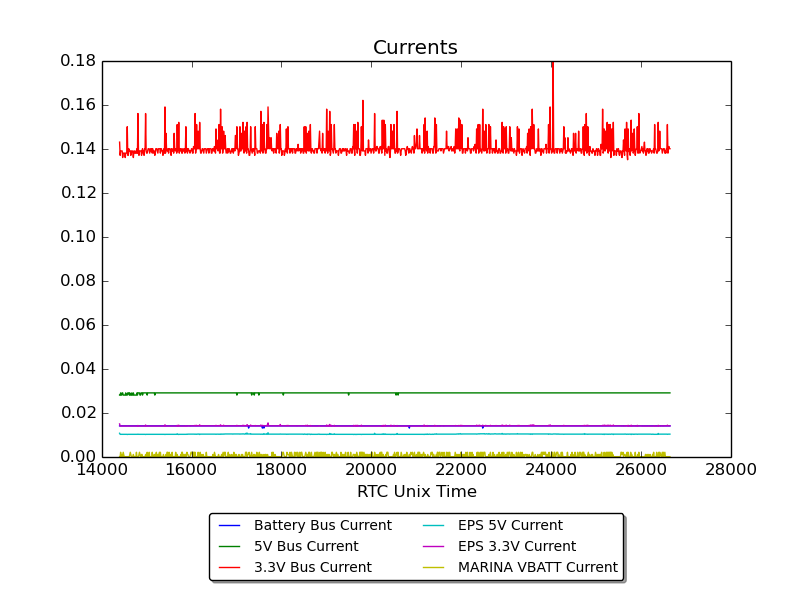
A quick look at bus current draws shows nominal performance. The spikes in 3V3 bus current correspond to occasional spikes in flight computer current draw as it processes data.
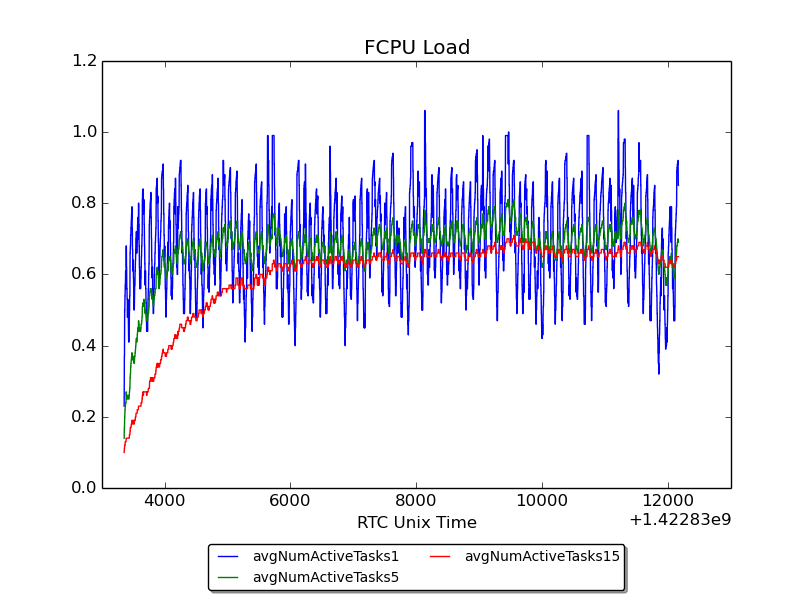
Finally, for all you Linux Sysadmins out there, we’ve got a plot of our FCPU load averages. As you can see, collecting 1-Hz telemetry loads our processor relatively heavily as it tries to keep up will all the serial I/O from the sensors.
With this data downlinked, we’ll be switching to MARINA data as the primary downlink content (we started on this right after our first MARINA run on the 11th). We’ll also be downlinking archived beacon data, as we do by default when we don’t have other data products to downlink – GRIFEX saves every beacon it transmits, and we’re trying to get the data from as many beacons as possible to make plots like the above over longer time periods.
We’ll continue to post updates as we downlink data. To all the Hams tracking GRIFEX, Thank You – Your information on satellite status and reception quality has been invaluable, and we’ve been able to downlink significantly more with your support than we would be able to alone.
73,
The Operations Team

